PIVOT TABLES
Who has better Pivot Tables? Excel vs. Google Sheets
Today we will explain the main similarities and differences between Microsoft Excel Pivot Tables and Google Sheets Pivot Tables. Each of them has its own pros and cons, so we will also address them.
The frequent use of Google tools makes people often confuse Microsoft Excel with Google Sheets. These are two different products, but with very similar, almost the same, functionalities. They are also compatible, so the Microsoft Excel document can be converted to Google Sheets document, and vice versa.
The process of Pivot Tables creation
Both Microsoft Excel and Google Sheets have the same steps of Pivot Table creation. There are six steps in the Pivot Table creation process. Here they are:
- Open or create raw data table
- Go to Insert tab and select Pivot Table
- Select a data range
- Choose Pivot Table location
- Confirm the creation of Pivot Table
- Customize a Pivot Table
You need more details on how to create Google Sheets Pivot Tables? We encourage you to download and read our eBook The Ultimate Guide to Google Sheets Pivot Tables. Here you will find all you need.
Although the process has the same steps, the major difference in this area is related to the visual appearance of windows which guide you through the process. Here below is the comparison of Create Pivot Table windows.
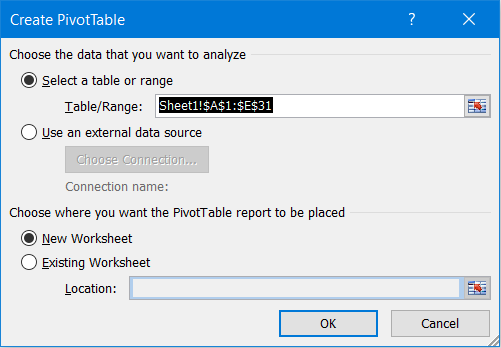

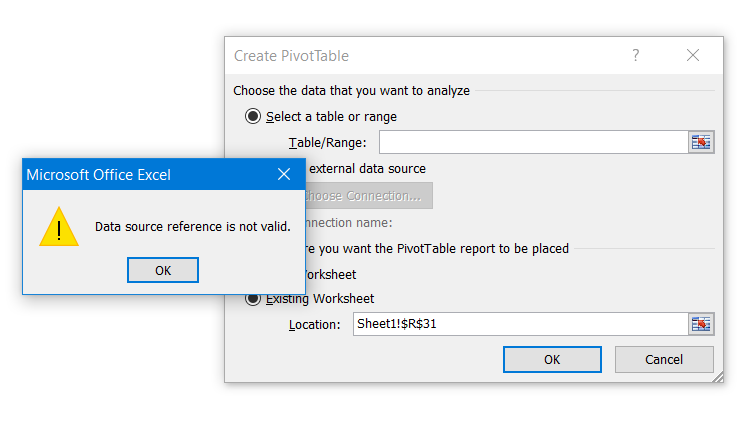
In case you try to create a Pivot Table without raw data selection, Microsoft Excel will inform you with a warning presented in a new window. Google Sheets will inform you inside the existing Pivot Table creation window.

Pivot Table Field List vs. Pivot table editor
After you confirm the Pivot Table creation, the final step is to customize a Pivot Table. This is the moment where you can start noticing main differences between Microsoft Excel Pivot Tables and Google Sheets Pivot Tables.
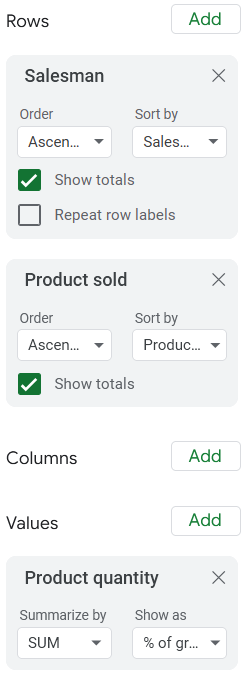
Microsoft Excel Pivot Tables offer customization through PivotTable Field List window. Pivot Tables in Google Sheets offer these functionalities through Pivot table editor window. Here is how they look.


The purpose of both of them is the same, because both give instructions to Pivot Table how to arrange the raw data inside it. Both of the windows have the area with shown columns from the raw data table which you can arrange. In our example case, these are: Shop ID, Salesman, Product sold, Product quantity and Product value.
Both of the windows have four fields where data can be placed. Their names differ between Microsoft Excel and Google Sheets, but they do the same. You can present your raw data in rows and columns. You can put them in the Values field to be calculated with some math operation. At the end, you can use data as filter criteria in order to narrow their representation depending on your needs.
Rich Pivot Tables advanced controls vs. convenience of use
Google Sheets is more intuitive and user-friendly than Microsoft Excel.
The main noticеable difference for all Google Sheets functionalities is that Google Sheets is much more intuitive. Google Sheets in Pivot table editor offers suggestions which you can simply choose. The suggestions are based on Google’s assumption of what you might need in this Pivot Table.
When you choose which data will be in Rows, Columns, Values or Filters fields, the new functionalities are at your disposal in both windows.

Microsoft Excel in this area is a little richer than Google Sheets, because it can offer you additional controls through sub-windows for every field you insert. For example, you can control data through Field Settings and Value Field Settings windows.
Google Sheets on the other side focused on the convenience of use and created a more modern and user-friendly environment. We must say that both of them offer everything you need for basic Pivot Table creation and usage.
Microsoft Excel is richer with advanced Pivot Table controls.
Having in mind Pivot Table Layout options, Microsoft Excel offers more options related to Subtotals, Grand Totals, Report Layout and Blank Rows. Some of these controls you can find in Google Sheets too, but are more limited than Microsoft Excel Pivot Tables.
Google Sheets collaboration features
Collaboration between multiple users on the Google Sheets document is easy by having a document sharing option. Microsoft Excel doesn’t have this feature, unless the Excel file is stored on a shared server. In the modern time of remote work this feature is far more significant and provides great flexibility for users. This is a great competitive advantage when comparing Microsoft Excel and Google Sheets in general.
Which Pivot Table to choose?
Now when we have reached the end, it’s good to conclude our comparison with some final words. As we already mentioned, both products will bring you to a main goal, and that is to create a flexible and easy to modify Pivot Table.
If you need some advanced features of Pivot Tables, Microsoft Excel will offer you more. On the other side, Google Sheets will offer you more convenience and a user-friendly environment with a modern look. Google Sheets Pivot Tables are also more intuitive with their suggestions. This is not available in Microsoft Excel Pivot Tables. When we talk about supporting the remote work, Google Sheets have share options. Chance to collaborate on the same document with your colleagues is really precious.
It is up to you and your team to decide what you prefer more. In case you missed it before, here you can download our eBook The Ultimate Guide to Google Sheets Pivot Tables.


